Waste management and Recycling
OWEN MULHERN | EARTH.ORG | JUL 31ST 2020 | 4 MINS
The figures and charts below reflect the historical data used in this July 2020 article; they are not current country rankings.
Waste management and Recycling
Waste is a first world problem. Materialism and consumerism have overtaken care for the environment, and buying more than we need has become a social norm. In this article, we explore waste generation and management, with an eye on high-income countries.
How much waste is produced each year?
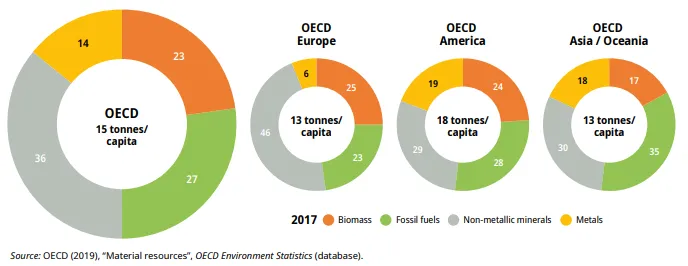
Source: OECD (2019), Material resources. Data: 2017.
A person living in an OECD country consumes on average about 15 tonnes of materials per year, which is higher than in other world regions (~12 tonnes per person). The highest material intensity per capita within OECD is the United States.
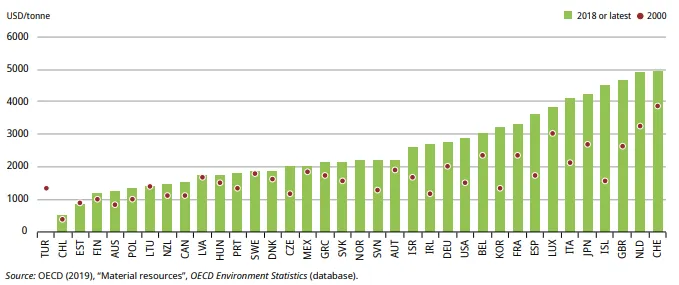
Source: OECD (2019), Material resources. Data: 2000 / 2018 (or latest available).
Between 2000 and 2018 (or the latest year available in the OECD’s 2019 dataset), the vast majority of OECD countries experienced improvements in material productivity, that is, GDP per unit of domestic material consumption, not revenue from waste. In that dataset, OECD countries generated on average USD $2600 per tonne of materials consumed, compared to USD $1700 per tonne in 2000. This reflects a general improvement in the efficiency of production processes and the substitution of domestic production with imports.The map below shows us that OECD countries (like the US, Australia, and European countries) have a higher waste generated per capita than developing countries.
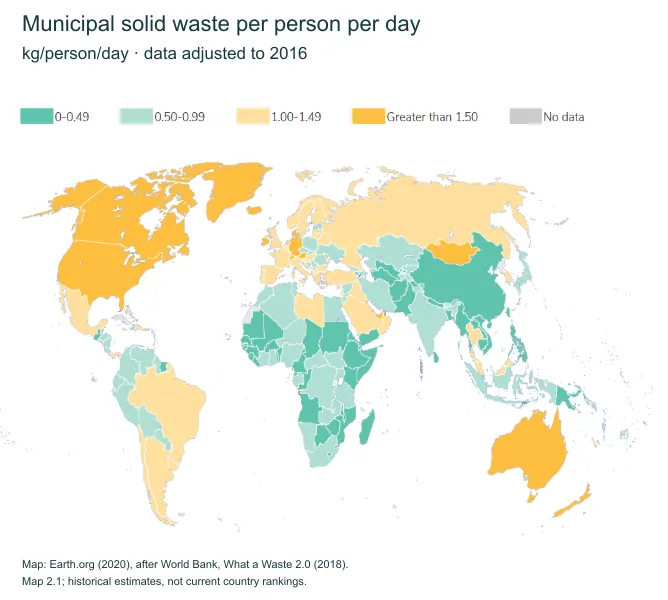
Map from Earth.org, 2020, based on World Bank, What a Waste 2.0, 2018, map 2.1. Unit: kg per person per day, not per year. National figures from different observation years were adjusted to the common reference year 2016; these are historical estimates.
Now, let’s look at the waste generated per capita each year in different OECD countries. Their citizens generate 506 kg on average per year. That is equivalent to more than 1000 pairs of shoes thrown out by each person each year. So the question everyone is asking is…
Types of Waste Management:
-
Landfill
-
Incineration with/ without energy recovery
-
Composting
-
Recycling
Here’s a quick look at how waste has been managed globally between 1995 and 2017.
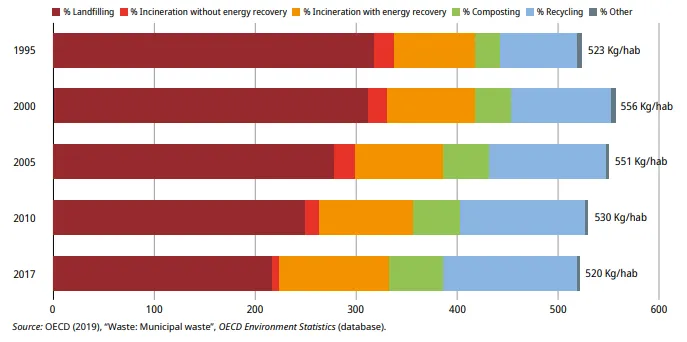
Source: OECD (2019), Waste: Municipal waste. Data: 1995–2017.
Between 1995 and 2017, more waste was diverted from landfills and incinerators and fed back into the economy through recycling, composting and incineration with energy recovery.
“Proper” waste management is being heralded by a few countries, while others like the US lag behind.
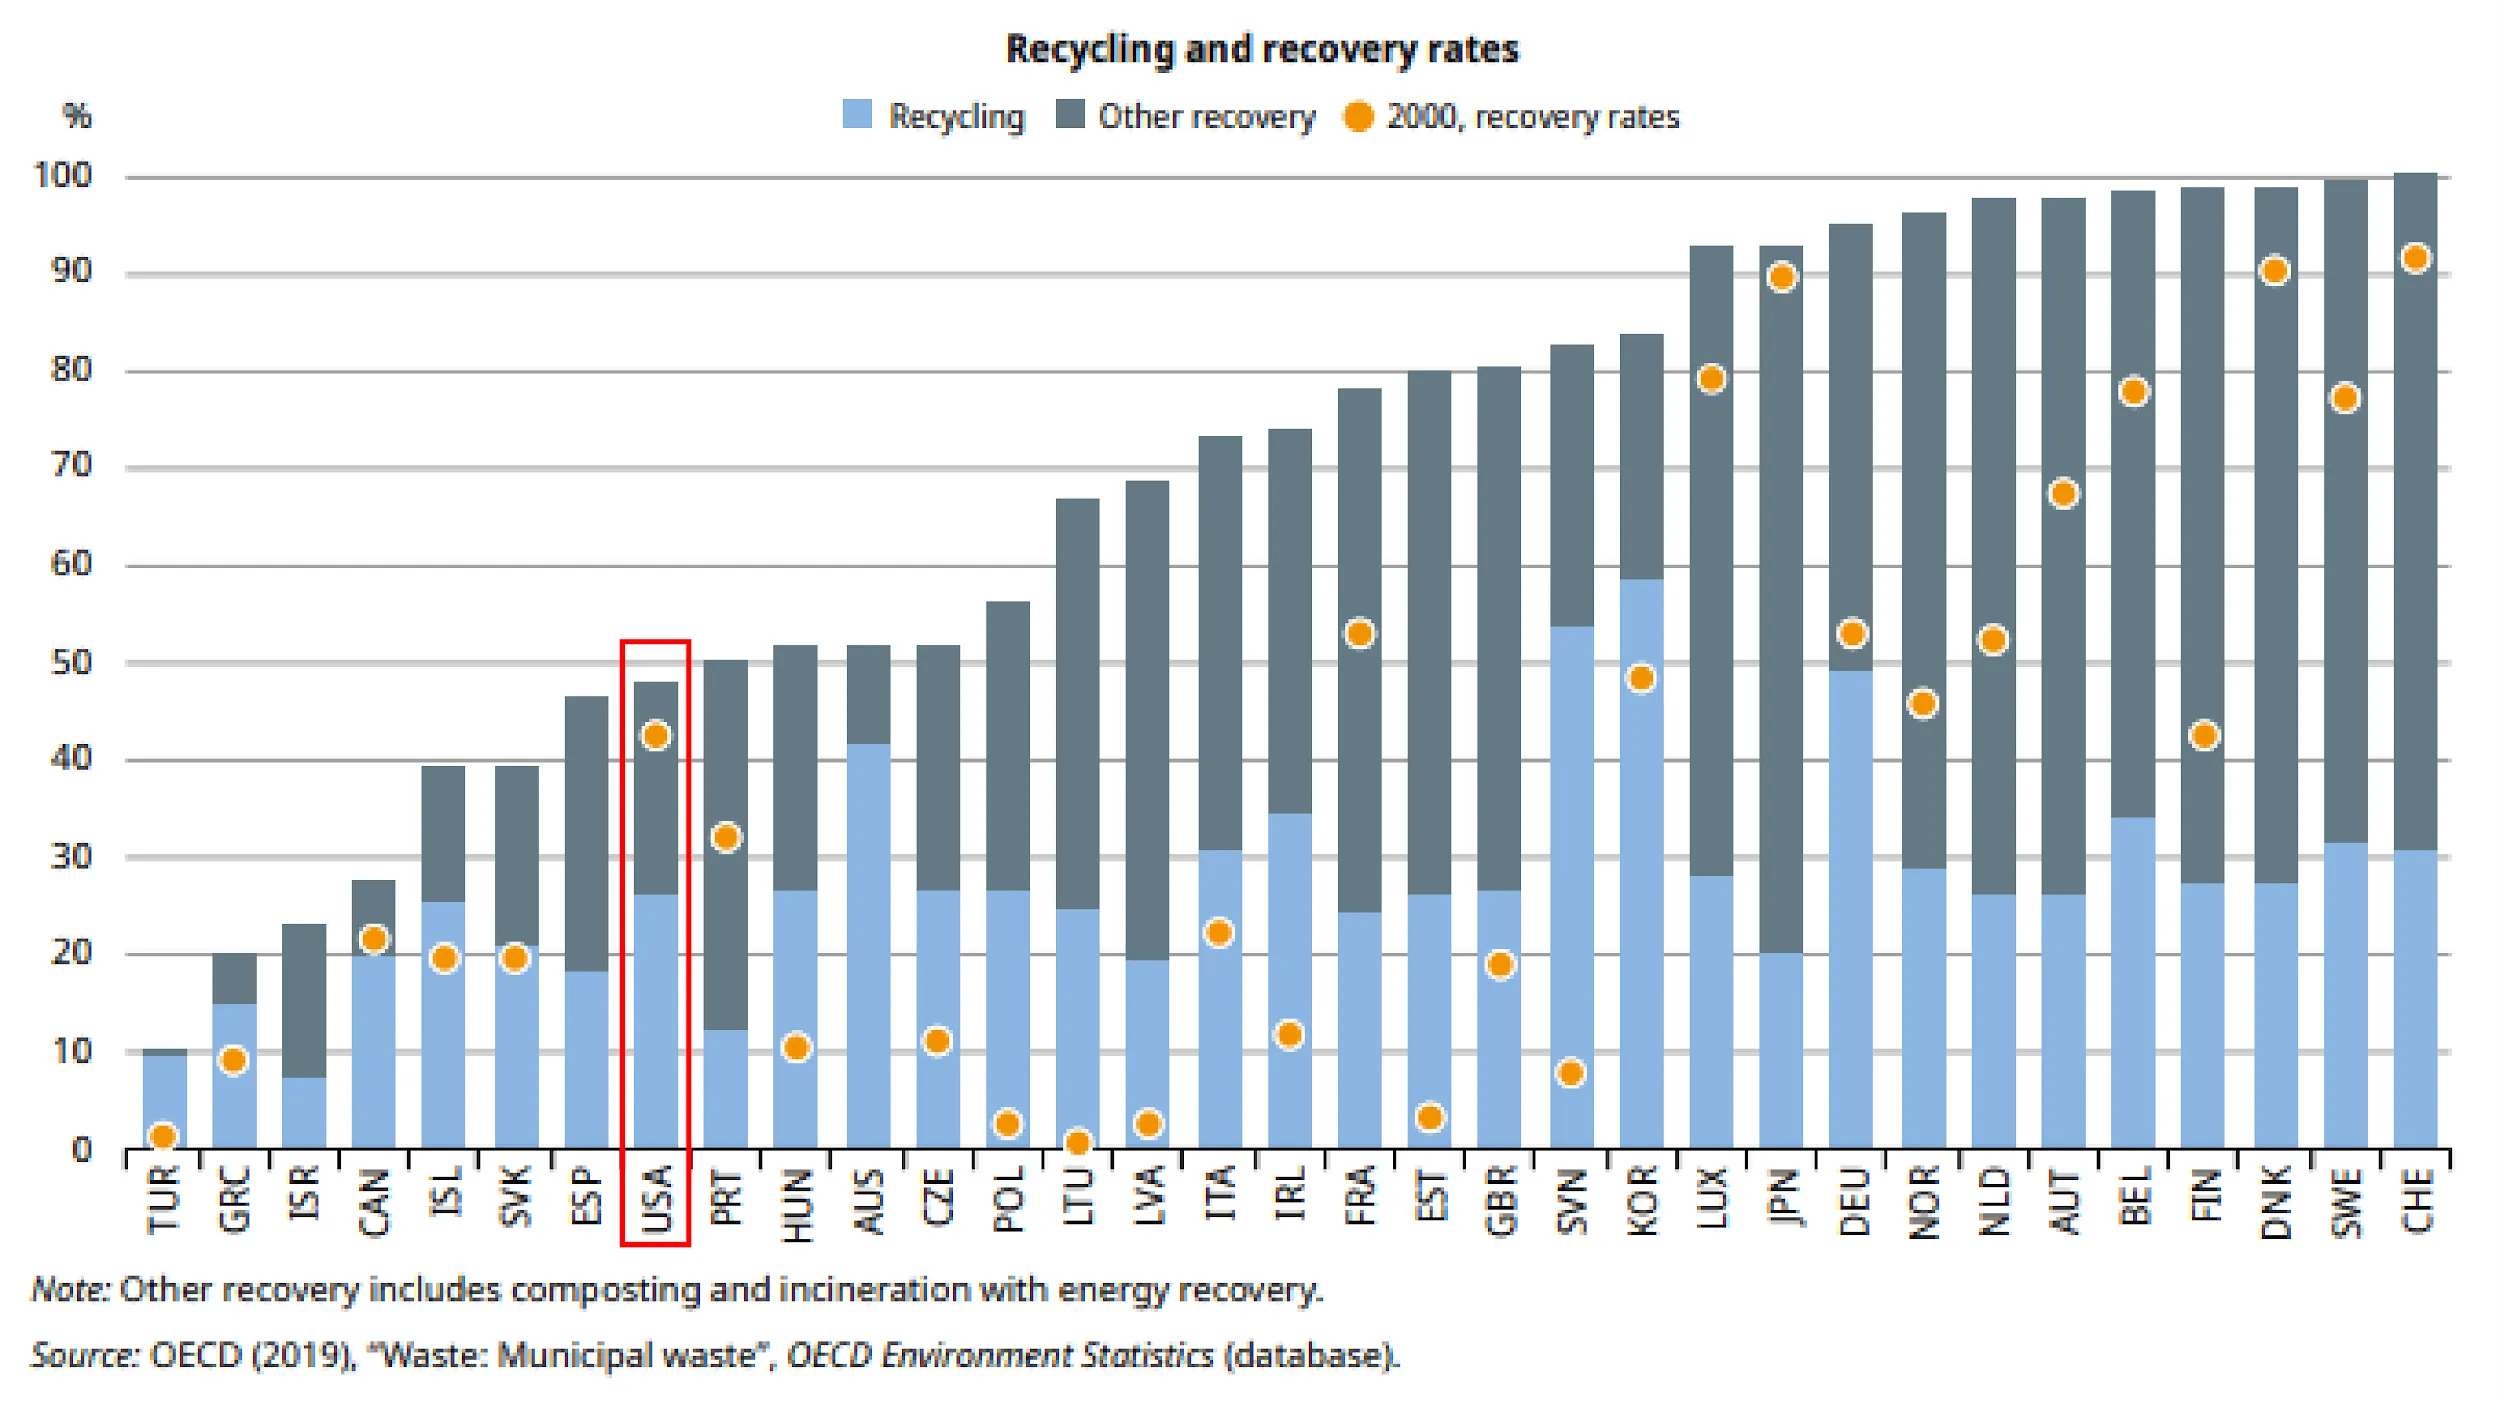
Source: OECD (2019), Waste: Municipal waste (source year; observation years vary; reference year not stated in this illustration).
As you may have noticed in the “Note” in the figure legend above, recovered waste includes incineration and composting. Let’s take a closer look at the waste disposal profiles below.
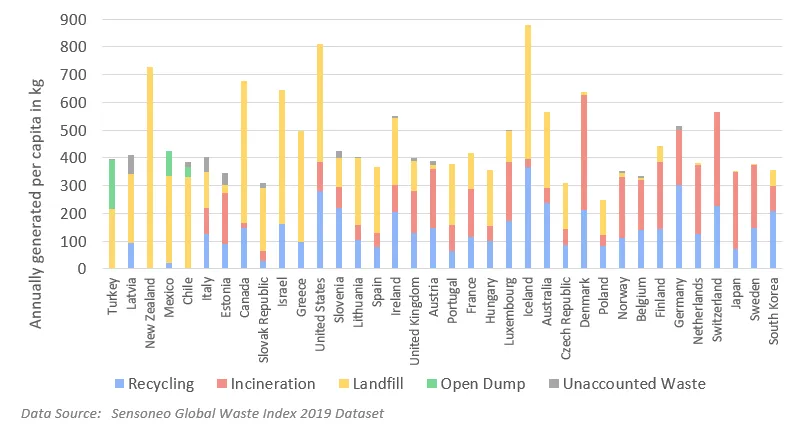
Source: Sensoneo Global Waste Index 2019 (source year; observation years vary).
Many of the countries who have eliminated landfills from their process have switched to incineration (red). Incinerators can decrease the quantity of waste by 95% and allows better management of odour and noise in comparison to landfill. For incinerators that incorporate waste to energy, it creates another opportunity for generating heat or electricity. For example, Sweden generates 8% of its heating needs from waste incinerators.
But is incineration the best substitute for landfilling? How efficient is converting waste to energy?
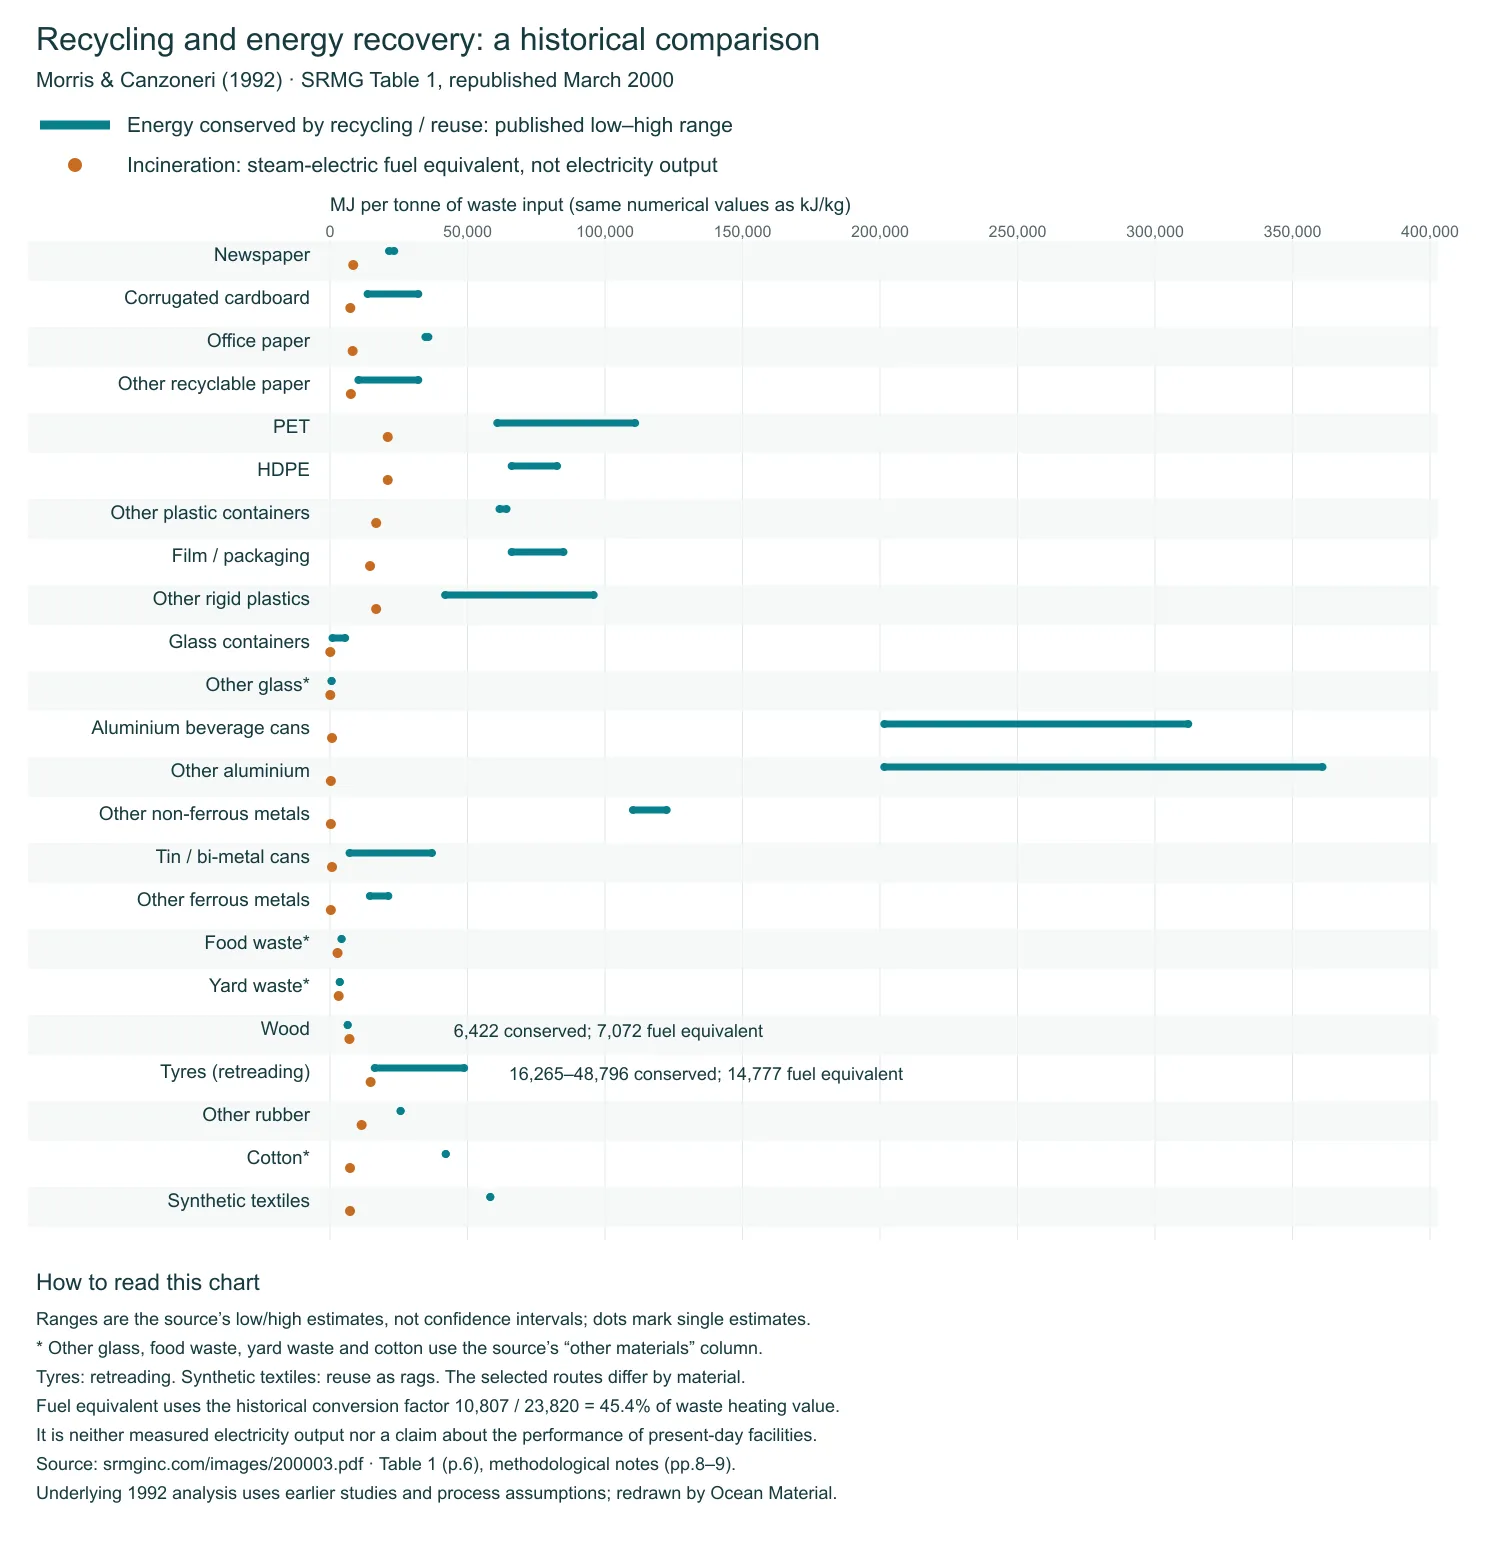
Redrawn from SRMG, March 2000, table 1 and notes, which republishes the Morris–Canzoneri analysis of 1992; the earlier illustration appeared on Earth.org in 2020. Unit: MJ per tonne of waste input (numerically equal to kJ/kg). Blue-green lines show the published low–high recycling/reuse estimates; orange points show incineration in steam-electric fuel equivalents, not electricity output. The historical conversion uses 45.4% of heating value. Other glass, food waste, yard waste and cotton use the table’s “other materials” column; the routes differ by material. These are older process assumptions, not measurements of current facilities.
In this historical comparison, most selected recycling or reuse routes conserve more energy than the incineration fuel equivalent. Tyre retreading is estimated at 16,265–48,796 MJ/t, compared with 14,777 MJ/t for incineration. Wood is an exception in the selected comparison: 6,422 versus 7,072 MJ/t.
Moreover, incineration emits smoke and ash, including acid gases, dioxin and nitrogen oxide that are harmful to both the environment and humans.
In a nutshell, transformation from landfilling to incineration has some advantages, but unfortunately not enough to offset our ecological footprints. This trend of upward transformation of waste management will have to continue in order to sustain our natural resources and energy.
So, it is great news that recycling is on the rise but it is important to look at the true effectiveness of this practice.
The Benefits of Recycling
According to the Environmental Protection Agency, recycling:
-
Aluminium cans save 95% of the energy needed to make new cans from raw materials;
-
recycling steel and tin cans saves 60 to 74%;
-
recycling paper saves about 60%; and
-
recycling plastic and glass saves about 30%
In fact, the energy saved by recycling one glass bottle will operate a 100-watt light bulb for four hours.
Recycling Myths
Unfortunately, recycling in certain places become myths as some of the plastics intended for recycling still end up in landfills or even disposed into oceans.
In most countries, some share of plastics intended for recycling are eventually rejected at local or regional waste handling facilities because of contamination and the lack of economic incentive.
Depending on recycling policies, targets, infrastructure and efficiency of recycling separation methods, the rate of rejected recycling can vary significantly between countries.
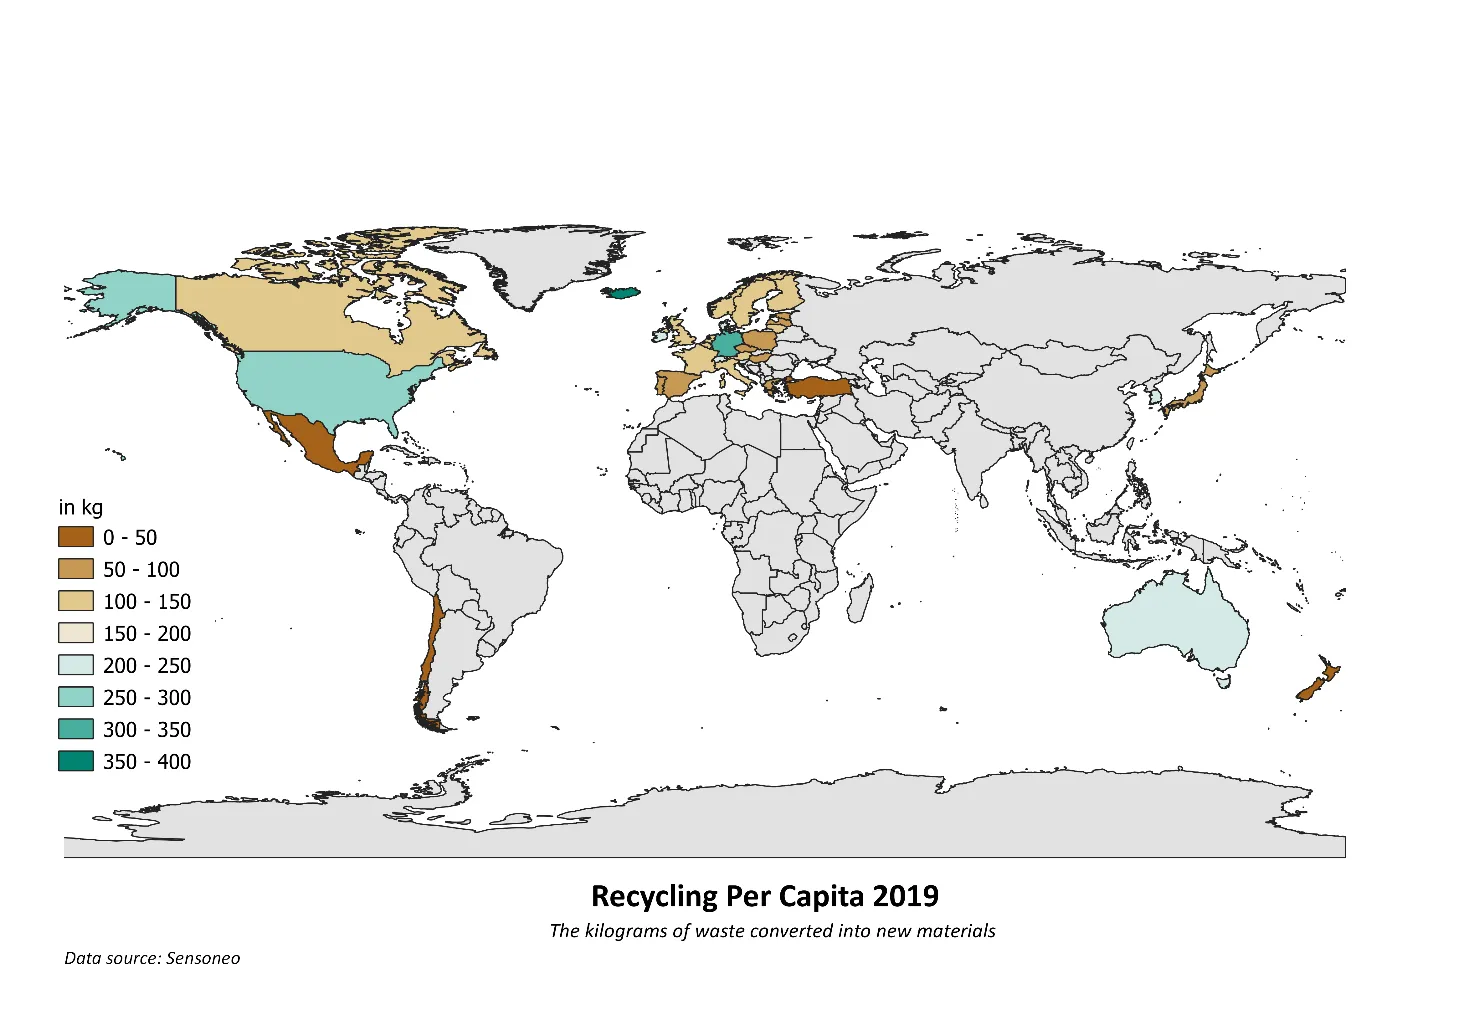
Source: Sensoneo Global Waste Index 2019.
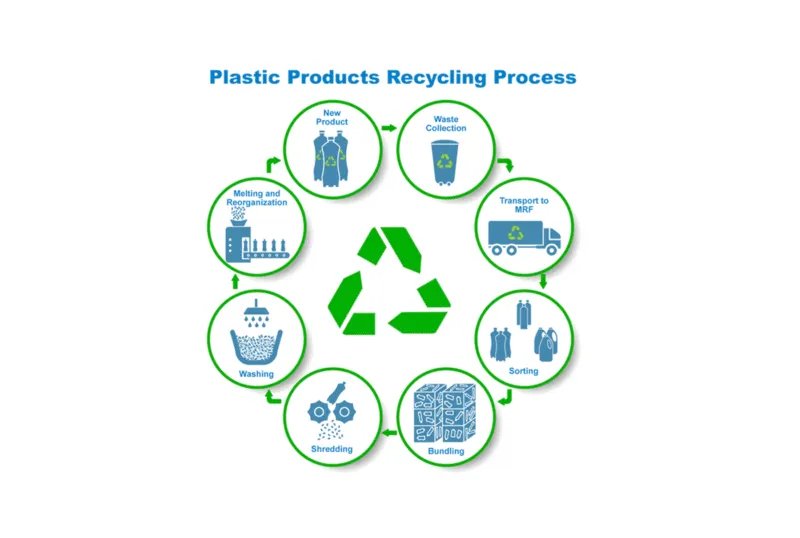
From collection to sorting to reprocessing, recycling is a multi-component process.
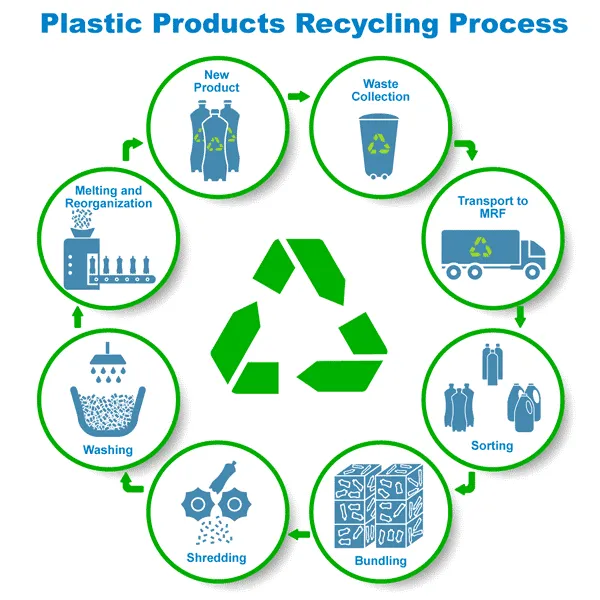
It requires the cooperation of various parties to work, including people who are willing to recycle, recycling manufacturers, companies willing to produce goods from recycled materials, and consumers who drive the demand for products made from green materials. The line breaks if any one party does not participate.
This means everyone, including you, makes up a key factor for improving the efficiency of recycling.
What can you do to help?
A common mistake is thinking that all plastics are recyclable when there are more varieties than you’d think. Educating yourself and those around you is the first step. Next, small efforts like cleaning your plastic waste avoid it being discarded for “contamination”.
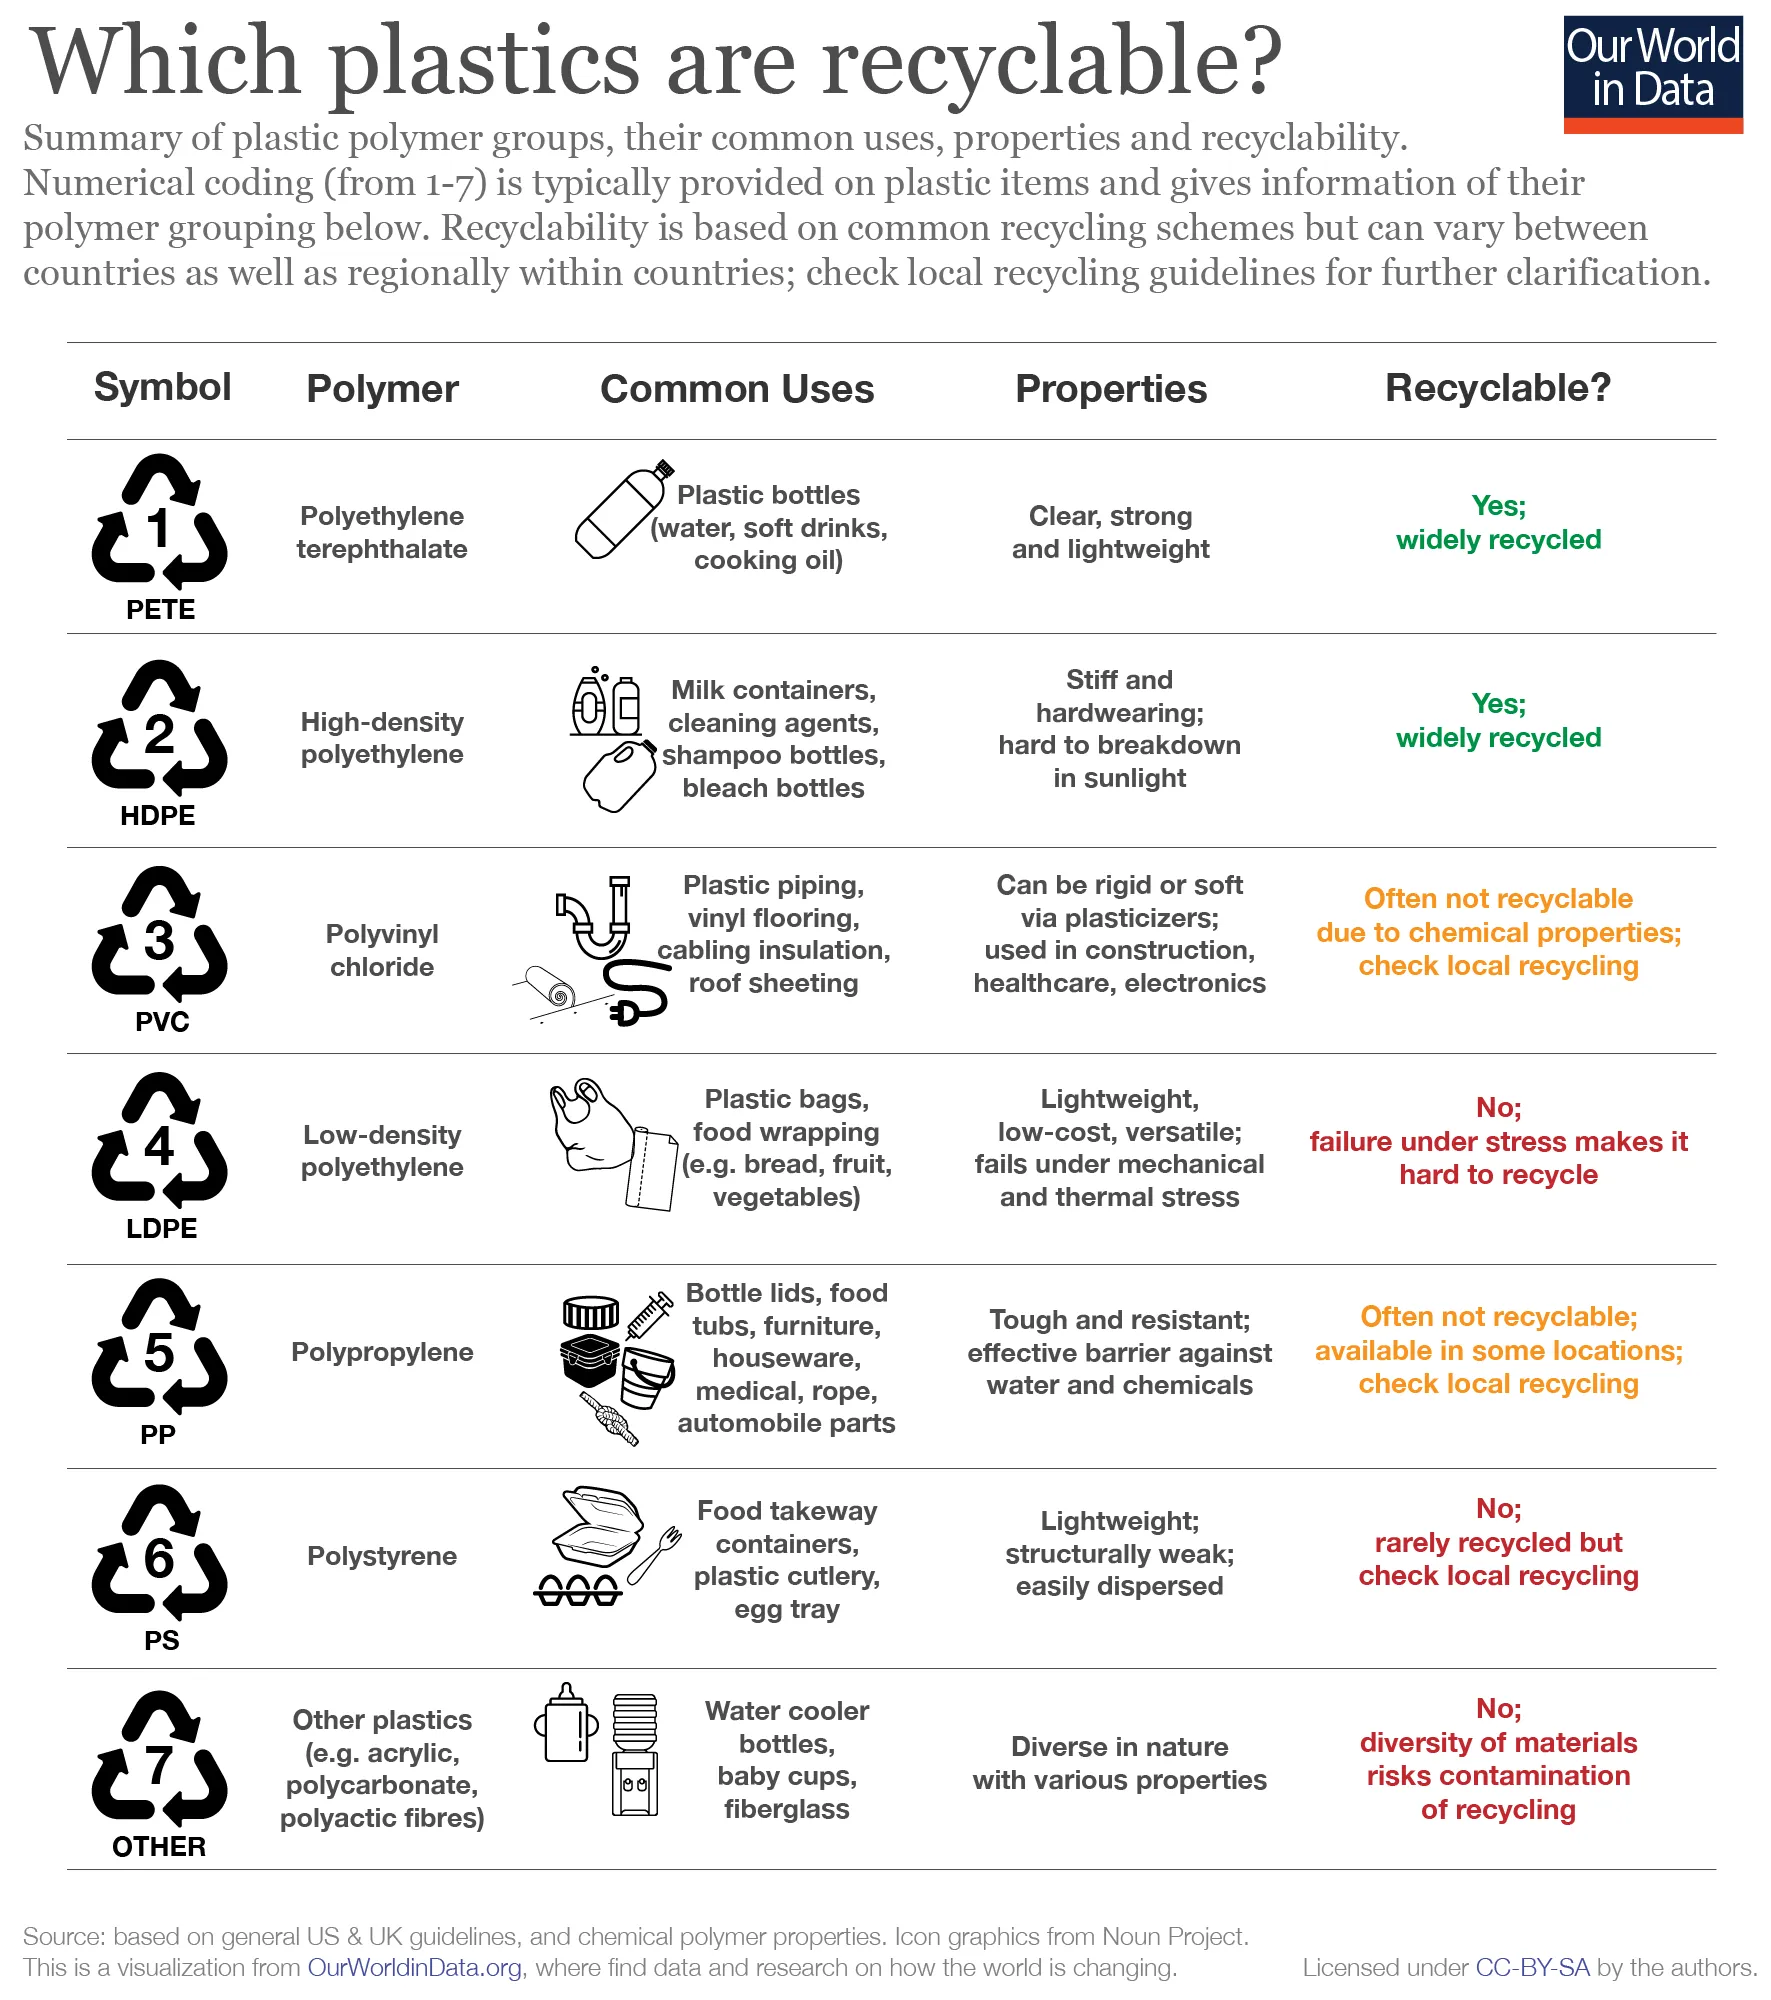
Ultimately, as consumers, we can create financial incentives for everyone to buy into the recycling process by purchasing recycled goods.
This article was written by Emily Victoria Lu and Owen Mulhern.
References
-
Howard, B. (2018, October 31). 5 recycling myths busted. Retrieved July 24, 2020, from https://www.nationalgeographic.com/environment/2018/10/5-recycling-myths-busted-plastic/
-
Kaza, S., Yao, L., Bhada-Tata, P., & Van Woerden, F. (2018). What a waste 2.0: a global snapshot of solid waste management to 2050. The World Bank.
-
Morris, Jeffrey, and Canzoneri, Diana. (1992, September) Recycling Versus Incineration: An Energy Conservation Analysis, Sound Resource Management Group (SRMG) Seattle, Washington.
-
OECD (2020), Environment at a Glance 2020, OECD Publishing, Paris, from https://doi.org/10.1787/4ea7d35f-en.
-
Ritchie, H. (n.d.). FAQs on Plastics. Retrieved July 24, 2020, from
-
The biggest waste producers worldwide: Sensonseo Global Waste Index 2019. (2020, March 25). Retrieved July 24, 2020, from https://sensoneo.com/sensoneo-global-waste-index-2019/
This article originally appeared on Earth.Org and is republished here as part of an editorial agreement.
Further reading: Which plastics can be recycled?
Explore more: