

BY HANNAH RITCHIE | OURWORLDINDATA.ORG | MAY 01ST 2021 | 10 MINS
Where does the plastic in our oceans come from?
Summary
80% of the world’s ocean plastics enter the ocean via rivers and coastlines. The other 20% come from marine sources such as fishing nets, ropes, and fleets. To tackle plastic pollution we need to know where these plastics are coming from. Previous studies suggested that a very small number of rivers were responsible for the vast majority of ocean plastics: 60% to 90% of plastics came from only ten rivers.
Higher-resolution mapping and consideration for factors such as climate, terrain, land use, and distance to the ocean suggests that many smaller rivers play a bigger role than we thought. It takes 1,600 of the biggest emitting rivers to account for 80% of plastic inputs to the ocean.
It is estimated that 81% of the plastic in our oceans come from Asian rivers. The Philippines alone contribute around one-third of the global total. Since the number of contributing rivers is much higher than previously thought, we will need global efforts to improve waste management and plastic collection rather than targeting only a few of the largest rivers.
Most of the plastic in our oceans comes from land-based sources: by weight, 70% to 80% is plastic that is transported from land to the sea via rivers or coastlines.1 The other 20% to 30% comes from marine sources such as fishing nets, lines, ropes, and abandoned vessels.2
If we want to tackle plastic pollution we need to stop it from entering the ocean from our rivers. The problem is that we have hundreds of thousands of river outlets through which plastics reach the oceans. To prioritize mitigation efforts we need to understand which of these rivers transport plastic to the sea, and which ones contribute the most.
In this article we look at the distribution of plastics across the world’s rivers; why some rivers carry a lot of plastics while others have very little; and which countries account for the largest share of plastic pollution.
Previous research suggested that only a handful of rivers transports almost all of the plastic to the sea – new research suggests this is not the case
Previous studies suggested that most plastics come from only a few of the world’s rivers: one study estimated that the top ten rivers were responsible for 50% to 60%; another for more than 90%.3
The latest research, which was just published in Science Advances, updates our understanding of how these plastics are distributed.4 Lourens Meijer et al. (2021) developed higher-resolution modeling of global riverine plastics. They found that rivers emitted around 1 million tonnes of plastics into the oceans in 2015 (with an uncertainty ranging from 0.8 to 2.7 million tonnes). Around one-third of the 100,000 river outlets that they modeled contributed to this. The other two-thirds emitted almost no plastic to the ocean. It’s an important point because we might think that most, if not all, rivers are contributing to the problem. This is not the case.
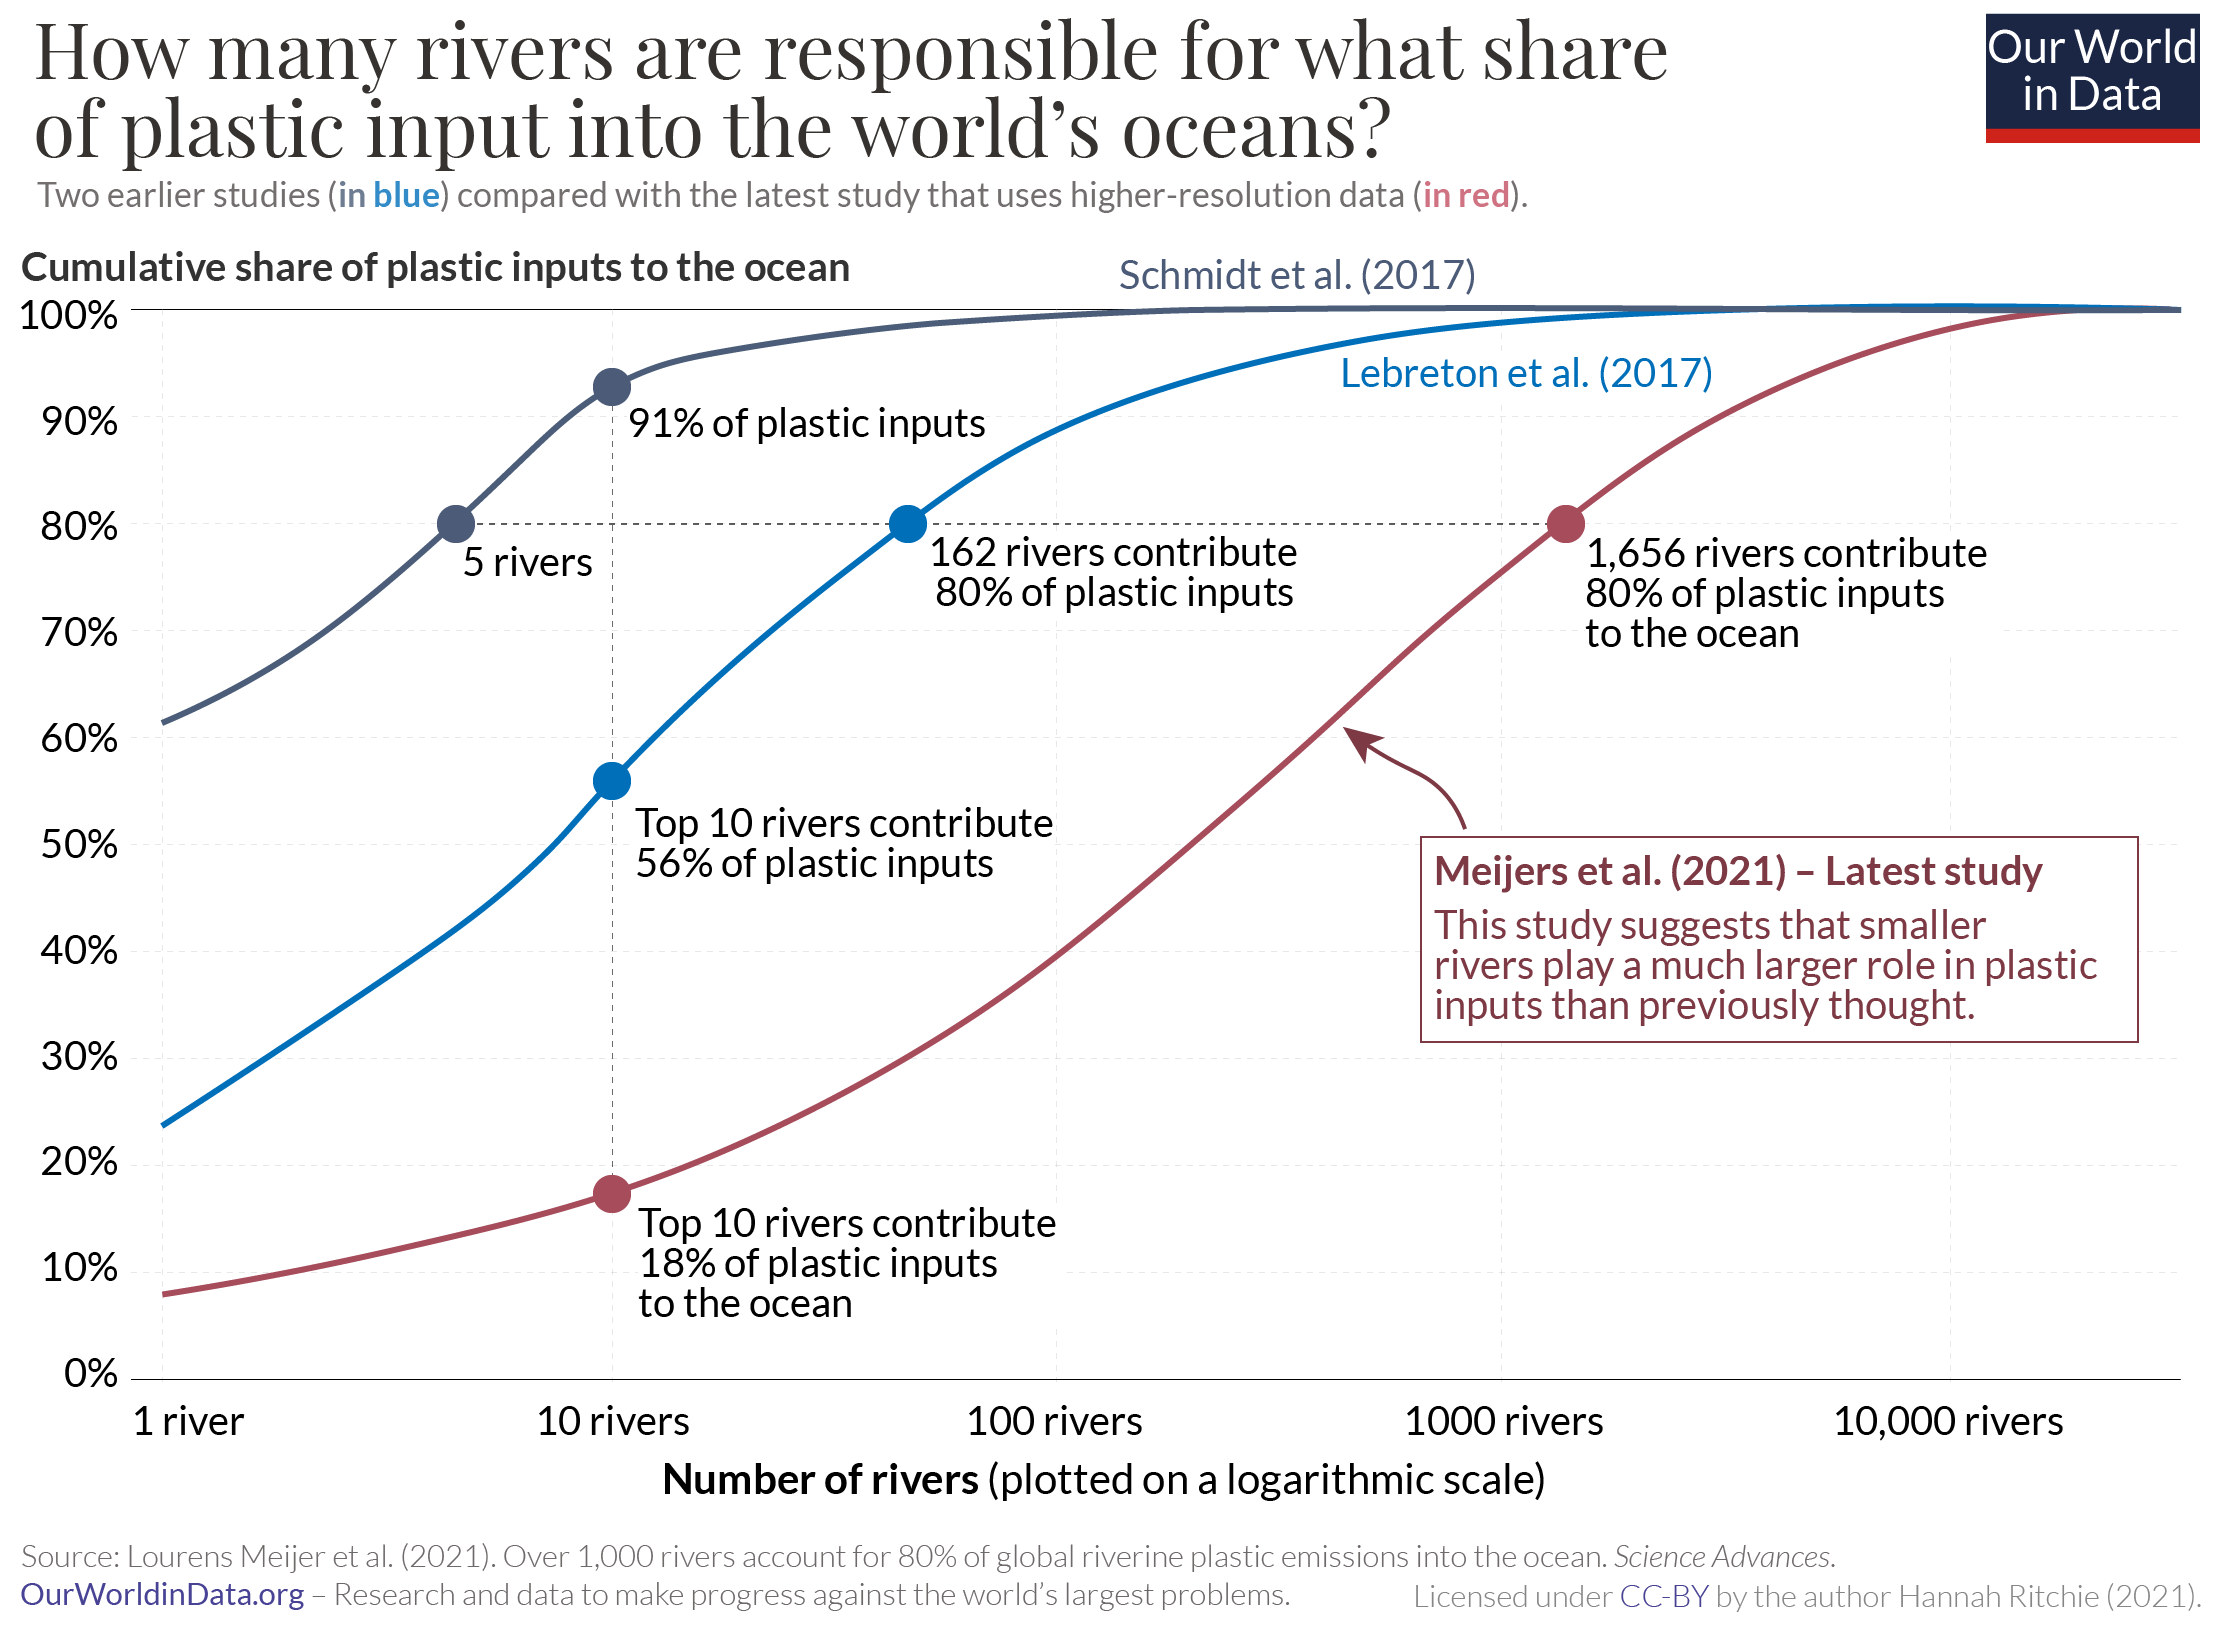
But, importantly, the latest research suggests that smaller rivers play a much larger role than previously thought. In the chart we see the comparison of the latest research (in red) with the two earlier studies which mapped global riverine inputs. This chart shows how many of the top-emitting rivers (on the x-axis) make up a given percentage of plastic inputs (y-axis). Note that the number of rivers on the x-axis is given on a logarithmic scale.
We see that the latest research suggests that the top ten emitting rivers contribute a much smaller amount than previously thought: just 18% of plastics compared to 56% and 91% from previous studies. And to account for 80% of river plastics we need to include the top 1,656 rivers. This compares to previous studies which suggested the largest five or 162 rivers were responsible for 80%.
This makes a massive difference to how we tackle plastic pollution. If five rivers were responsible for most of the problem then we should focus the majority of our efforts there. A targeted approach. But if this comprises thousands of rivers we’re going to need to cast a much wider net of mitigation efforts.
Why are the latest results so different? The earlier studies relied on simpler models of waste generation within the world’s river basins. They took assessments of the amount of mismanaged waste generated in each basin; population density in the area; and correlative models of plastic concentrations in surface rivers. They then used these relationships to model the amount of pollution from basins where recorded data on river plastics was not available. This meant that the biggest emitters were believed to be the very large river basins home to large populations and poor waste management practices. The Yangtze, Xi, and Huangpu rivers in China; the Ganges in India; Cross in Nigeria; and the Amazon in Brazil were the big rivers that topped the list.5
The latest analysis builds on this earlier research with much higher-resolution data. It models the deterministic drivers of how plastic is transported using wind and precipitation patterns and river discharge data – plus factors that affect the probability of plastic first entering rivers, then entering the ocean such as the proximity of populations to the river; distance to the ocean; the slope of the terrain, and types of land use. This higher-resolution data was based on several years of research and calibrations of these models across 66 rivers in 14 countries.
This higher-resolution data shows that these factors that affect the probability of plastics not only reaching the river but then also reaching the ocean play a much more important role than the size of the river basin itself. This means many smaller rivers play a bigger role than we thought.
Which rivers emit the most plastic to the ocean?
To tackle plastic pollution we need to know what rivers these plastics are coming from. It also helps if we understand why these rivers emit so much.
Most of the world’s largest emitting rivers are in Asia, with some also in East Africa and the Caribbean. In the chart we see the ten largest contributors. This is shown as each river’s share of the global total. You can explore the data on the top 50 rivers using the +Add river button on the chart.6
Seven of the top ten rivers are in the Philippines. Two are in India, and one in Malaysia. The Pasig River in the Philippines alone accounts for 6.4% of global river plastics. This paints a very different picture to earlier studies where it was Asia’s largest rivers – the Yangtze, Xi, and Huangpu rivers in China, and Ganges in India – that were dominant.
What are the characteristics of the largest emitting rivers?
First, plastic pollution is dominant where the local waste management practices are poor. This means there is a large amount of mismanaged plastic waste that can enter rivers and the ocean in the first place. This makes clear that improving waste management is essential if we’re to tackle plastic pollution. Second, the largest emitters tend to have cities nearby: this means there are a lot of paved surfaces where both water and plastic can drain into river outlets. Cities such as Jakarta in Indonesia and Manila in the Philippines are drained by relatively small rivers but account for a large share of plastic emissions. Third, the river basins had high precipitation rates (meaning plastics washed into rivers, and the flow rate of rivers to the ocean was high). Fourth, distance matters: the largest emitting rivers had cities nearby and were also very close to the coast.
The authors of the study illustrate the importance of the additional climate, basin terrain, and proximity factors with a real-life example. The Ciliwung River basin in Java is 275 times smaller than the Rhine river basin in Europe and generates 75% less plastic waste. Yet it emits 100 times as much plastic to the ocean each year (200 to 300 tonnes versus only 3 to 5 tonnes).7 The Ciliwung River emits much more plastic to the ocean, despite being much smaller because the basin’s waste is generated very close to the river (meaning the plastic gets into the river network in the first place) and the river network is also much closer to the ocean. It also gets much more rainfall meaning the plastic waste is more easily transported than in the Rhine basin.
If you want to explore the plastic inputs from each of the world’s rivers, the Ocean Cleanup Project provides a beautiful interactive map where you can see this in more detail.
Which countries emit the most plastic to the ocean?
Asia accounts for 81% of global plastic inputs to the ocean
We’ve looked at the role of individual rivers, but how do these aggregate at the regional and country-level? Which countries emit the most plastic to the ocean?
In the chart we see the breakdown of global plastic inputs to the ocean by region. 81% of ocean plastics are emitted from Asia. The fact that a disproportionate amount of plastic pollution comes from Asia is consistent with previous research. Earlier studies estimated its share in 2010 was 86%.8 This should also not surprise us given the fact that Asia is the world’s most populous region (home to 60% of the world population); plus all of the top ten emitting rivers were in Asia (Philippines, India, and Malaysia), and most of the top 50. Africa was responsible for 8%; South America for 5.5%; North America for 4.5%; and Europe and Oceania combined were less than 1%.
More than one-third of ocean plastic inputs come from the Philippines
The distribution of plastic inputs is reflected on the world map. There we see each country’s share of global plastic emissions.
The Philippines accounts for more than one-third (36%) of plastic inputs – unsurprising given the fact that it’s home to seven of the top ten rivers. This is because the Philippines consists of many small islands where the majority of the population lives near the coast. But it’s an important update on our previous understanding of where China and India were thought to dominate. India accounts for 13%, and China for 7%.
People often find this global distribution surprising. Since consumers in rich countries tend to use a lot more plastic people expect that they contribute a lot more to plastic pollution than they actually do. And it’s not just about population size: even on a per capita basis, rich countries contribute very little plastic to the ocean. European countries, for example, emit less than 0.1 kilograms of plastic per person. This compares to 3.5 kilograms in the Philippines or 2.4 kilograms in Malaysia.
This relationship is shown on the scatterplot here: on the y-axis, we have per capita plastics emitted to the ocean, and on the x-axis, we have GDP per capita. We see the largest per capita contributors tend to lie in the middle of the income distribution.
What determines each country’s contribution to plastic in our oceans?We can understand what determines each country’s contribution through three steps. First, the amount of plastic waste that each country generates in the first place. Rich countries produce much more plastic waste per person than poorer countries. Most produce 0.2 to 0.5 kilograms per person per day.9 This compares to 0.01 in India or 0.07 kilograms in the Philippines. Even when we multiply by population (giving us total plastic waste generation), rich countries generate a lot. The UK, for example, generates twice as much plastic waste as the Philippines. Second, how this plastic waste is managed. Plastic will only enter rivers and the ocean if it’s poorly managed. In rich countries, nearly all of its plastic waste is incinerated, recycled, or sent to well-managed landfills. It’s not left open to the surrounding environment. Low-to-middle income countries tend to have poorer waste management infrastructure. Waste can be dumped outside of landfills, and landfills that do exist are often open, leaking waste to the surrounding environment. Mismanaged waste in low-to-middle income countries is therefore much higher. |
Third – and this is where this recent research improves our understanding – is the probability that this mismanaged plastic waste reaches river networks, and then the ocean. The climate, terrain, land use, and distances within river basins affect the probability that mismanaged plastic waste is emitted to the ocean.
The probability of mismanaged plastic waste entering the ocean by country is shown in the chart. This probability is much higher in countries such as the Philippines (a 7% probability); Malaysia (4.4%); and Sri Lanka (3.4%) than China (0.2%) or India (0.5%). This is why smaller rivers in these countries play a larger role than we might assume.
To tackle plastic pollution we need to know where it’s coming from
Identifying where plastic emissions are coming from really matters for how we tackle it. Rich countries emit very little – this means domestic strategies to reduce plastics in these countries will not make much difference to plastic in our oceans. What rich countries can do is support low-to-middle income countries in improving waste management infrastructure. Improving waste management is a solution that very few people get excited about. But it’s absolutely key to tackling plastic pollution. And, importantly, they can ban the export of any plastics to other countries where it could be mismanaged.
Understanding the distribution of emissions across the world’s rivers is also crucial. Our strategy for tackling this problem is vastly different if we only have to focus on a few or even tens of the world’s largest rivers (as previous studies suggested) versus thousands of smaller ones.
To stop plastic pollution in our oceans we need a global approach to reducing plastic waste and managing it appropriately to stop it leaking into the natural environment. Focusing on a few rivers will not be enough.
Endnotes
1. Li, W. C., Tse, H. F., & Fok, L. (2016). Plastic waste in the marine environment: A review of sources, occurrence and effects. Science of the Total Environment, 566, 333-349.
Lebreton, L., Slat, B., Ferrari, F., Sainte-Rose, B., Aitken, J., Marthouse, R., … & Noble, K. (2018). Evidence that the Great Pacific Garbage Patch is rapidly accumulating plastic. Scientific Reports, 8(1), 4666.
2. In certain locations, the share that comes from marine sources can be higher. For example, it’s estimated that plastic lines, ropes and fishing nets make up 52% of the plastic mass in the ‘Great Pacific Garbage Patch’ (GPGP).
Lebreton, L., Slat, B., Ferrari, F., Sainte-Rose, B., Aitken, J., Marthouse, R., … & Noble, K. (2018). Evidence that the Great Pacific Garbage Patch is rapidly accumulating plastic. Scientific Reports, 8(1), 4666.
3. Lebreton, L. C., Van der Zwet, J., Damsteeg, J. W., Slat, B., Andrady, A., & Reisser, J. (2017). River plastic emissions to the world’s oceans. Nature Communications, 8, 15611.
Schmidt, C., Krauth, T., & Wagner, S. (2017). Export of plastic debris by rivers into the sea. Environmental Science & Technology, 51(21), 12246-12253.
4. Meijer, J.J.L, Emmerik, T., Ent, R., Schmidt, C., Lebreton, L. (2021). More than 1000 rivers account for 80% of global riverine plastic emissions into the ocean. Science Advances.
5. Lebreton, L. C., Van der Zwet, J., Damsteeg, J. W., Slat, B., Andrady, A., & Reisser, J. (2017). River plastic emissions to the world’s oceans. Nature Communications, 8, 15611.
6. Note that for individual rivers the confidence interval can be large, and estimates can vary from model predictions.
7. The Ciliwung River emitted between 205 and 308 tonnes per year. The Rhine emitted 3 to 5 tonnes per year.
8. Lebreton, L. C., Van der Zwet, J., Damsteeg, J. W., Slat, B., Andrady, A., & Reisser, J. (2017). River plastic emissions to the world’s oceans. Nature Communications, 8, 15611.
9. Jambeck, J. R., Geyer, R., Wilcox, C., Siegler, T. R., Perryman, M., Andrady, A., … & Law, K. L. (2015). Plastic waste inputs from land into the ocean. Science, 347(6223), 768-771.
License Agreement
All visualizations, data, and code produced by Our World in Data are completely open access under the Creative Commons BY license.
Explore more:
- Discover our recycled materials
- Learn about our mission
- 🇩🇪 Lesen Sie diesen Artikel auf Deutsch
- 🇨🇳 阅读中文版
01.05.2021